Freshness
The table didn't receive data when it normally would.
orders loads every day; today has no rows for yesterday.
Sentry is an AI agent that automatically catches data quality issues before they affect your business.
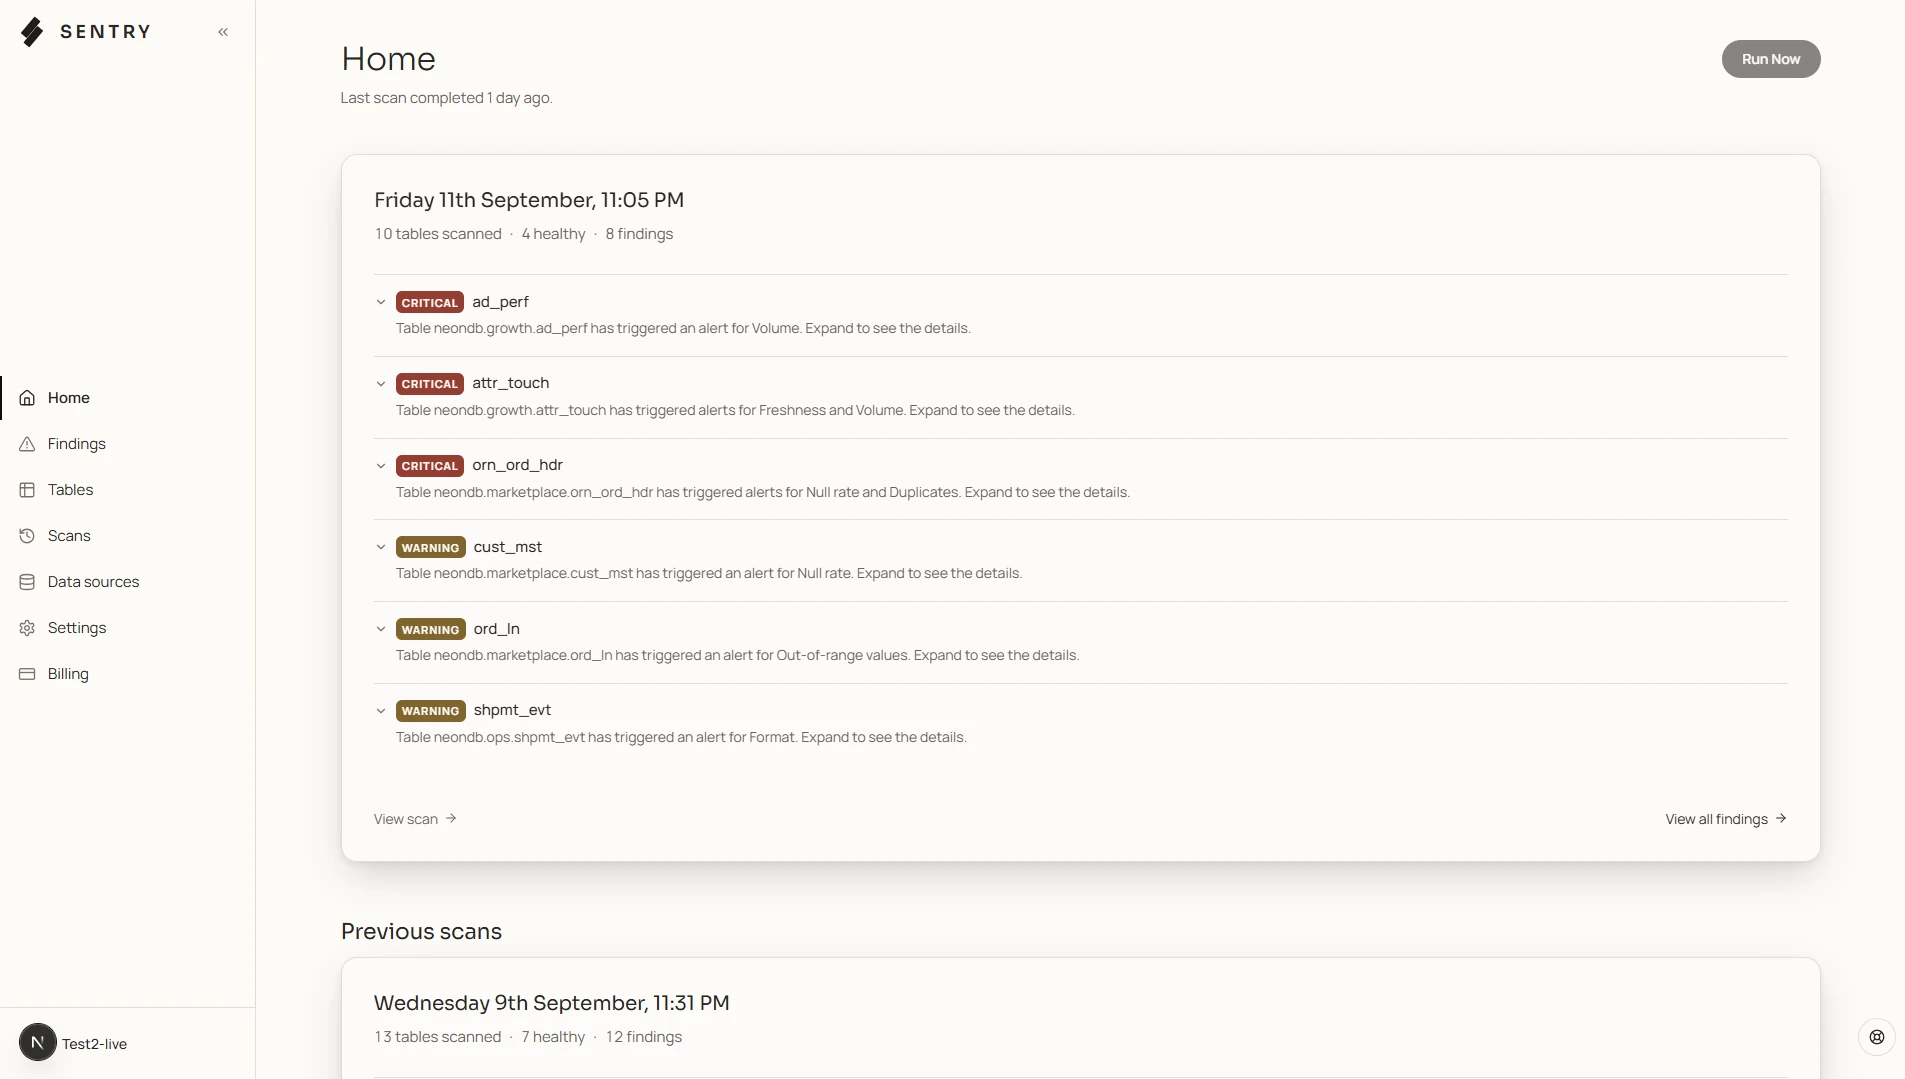
Each check learns what normal looks like for that table and compares the latest run to it.
The table didn't receive data when it normally would.
orders loads every day; today has no rows for yesterday.
Row counts deviate from the historical load pattern.
Usually about 10k rows a day; today, 200.
Values land far outside the learned distribution.
Every prior order value sat within 1 SD; today's max is 5 SDs out.
A column's null share spikes.
email is historically 2% null, suddenly 40%.
Values violate the column's established format.
A numeric column starts receiving strings; date formats shift.
Uniqueness of key columns breaks.
order_id was always unique; today it has duplicates.
Sentry reads each table's schema and its first profile, then proposes tailored checks that catch issues other tools would miss — negative amounts, unknown status codes, orders pointing at customers that no longer exist.
orders · proposed plan
Status stays inside the four known states
status not in ('pending', 'paid', 'refunded', 'cancelled')
0 today·0 typical
CRITICALEvery order points at a customer that exists
orders.customer_id with no customers.id
400 today·12 typical
Delivery never precedes the order
delivered_at < created_at
0 today·0 typical
The AI agent looks across all your tables and decides which ones are worth custom checks.
The agent revisits your tables and checks as your schema, findings and feedback change.
Sentry profiles ninety days of each table's history and judges every night against that rhythm: weekend dips, Monday loads, month-end spikes.
orders · rows per day
01
Point Sentry at your warehouse with read-only credentials you create. Snowflake, BigQuery, Redshift, Databricks, ClickHouse, Postgres, MySQL and SQL Server are supported.
02
Browse your schema and tick the tables that matter. Each one gets a priority tier — Critical, Normal or Low — which feeds severity judgment and digest ordering.
03
Sentry profiles each table's history to learn its normal behaviour: load cadence, value distributions, null rates, formats. No thresholds for you to guess at.
04
Every night, after your data has finished loading, the six check agents run against every monitored table. Defaults to 5:00 AM in your timezone; change it whenever your ingest window moves.
05
Every morning see your results in a daily digest email or in the dashboard. Issues are ranked by severity.
06
Open a finding to see the agent's plain-English diagnosis and the evidence behind it. Resolve it, mute it, or mark it expected — which teaches the baseline not to flag it again.
Sentry only surfaces what matters to you, and you can teach it to ignore the rest.
customers · Null-rate
email is 38% null today; baseline is 2%.
One click on a finding — a holiday dip, a planned backfill — and the agent folds it into the baseline. It will not flag that pattern again.
Silence one check on one table for a chosen period. "We know this pipeline is down this week".
A per-table setting from paranoid to relaxed, controlling how aggressively agents flag deviations. Available on Scale and Ultra.
No thresholds, no YAML, no test-writing. Sentry profiles each table you select and learns its normal behaviour — load cadence, value distributions, null rates, formats — from its own history. Setup is: connect, pick tables, done.
Never. Sentry connects with read-only credentials you create, and it diagnoses only — it never writes to your warehouse and never attempts a fix. Every finding hands you the diagnosis and the evidence; the decision stays with you.
Snowflake, BigQuery, Redshift, Databricks, ClickHouse, Postgres, MySQL and SQL Server.
Whenever your data has finished loading. The nightly scan defaults to 5:00 AM in your organisation's timezone and is editable at any time from account settings.
A severity (Critical, Warning or Info, weighted by the table’s priority tier), a plain-English diagnosis of what the agent found, and the evidence behind it: the queries run, sample offending values, and the historical baseline it was judged against — so you can verify the claim in seconds.